Every number on a lab report sits beside a range, and the range looks like a verdict. Inside it, fine. Outside it, a problem. It is neither. Most reference ranges are a description of other people, and once you know how they are drawn, you read the page differently.
How a range gets made
For most markers, a lab tests a large group of people it considers healthy, lines the results up from lowest to highest, and trims off the bottom 2.5 percent and the top 2.5 percent. The middle 95 percent becomes the reference range.
Two things follow from that, and neither is obvious from the sheet.
First, by construction, one healthy person in twenty lands outside the range on any given test. Order twenty tests and a perfectly healthy person will more often than not see at least one flag. A value outside the range is a reason to look closer, not a finding on its own.
Second, “healthy” in a reference group usually means no known disease, which is not the same as well. When a problem is common and quiet in the general population, the people who have it without knowing end up in the sample, and the range stretches to include them. The middle 95 percent of a population is what is usual. Usual and healthy overlap, but they are not the same thing.
Some markers are not drawn this way at all. Cholesterol and blood sugar cutoffs mostly come from long studies that linked levels to outcomes, which is why LDL on many sheets reads simply “under 100”, with no lower bound. Those are decision limits, set by guideline committees, and they change when the evidence does. Ranges also differ from lab to lab, because methods and populations differ, so a value belongs with the range printed beside it, not one found online.
Your normal is narrower than the range
For a lot of markers, each person’s values cluster in a band much narrower than the population range. Your own normal sits somewhere inside it, and that has a quiet consequence: a value can travel from the bottom of the range to the top over a few years and never once trip a flag. Every report says “in range”. The direction says something else.
That is why a single value is a snapshot and three values are a story. One result can be nudged by things that have nothing to do with your long-term health: whether you fasted, how hydrated you were, a hard workout the day before, a cold you were fighting (inflammation markers such as CRP rise with ordinary infections). A surprising number on its own deserves a repeat before it deserves a conclusion. A number that moves the same way three times in a row deserves a conversation.
“Optimal” is the word people reach for here, meaning the part of the range associated with the best outcomes rather than merely the usual ones. It is a useful idea and a judgment call, narrower than the reference range and not settled for every marker. Treat it as a question to bring to your doctor, not an answer.
How Wave reads the sheet
In Wave Wellness you can photograph the sheet, even a scanned fax, upload a PDF, or type the values in. The photo is read as a page, not flattened into a stream of text, because some labs flag abnormal values in a separate column. Flatten the page and an H can drift away from the row it belongs to. Read the page as a page and it stays with its number.
Every value is then shown beside the page it came from, so you can check the read against the original before anything is saved. You keep or discard each one, or Keep all. Nothing reaches a chart until you have kept it. The catalog covers 52 markers.
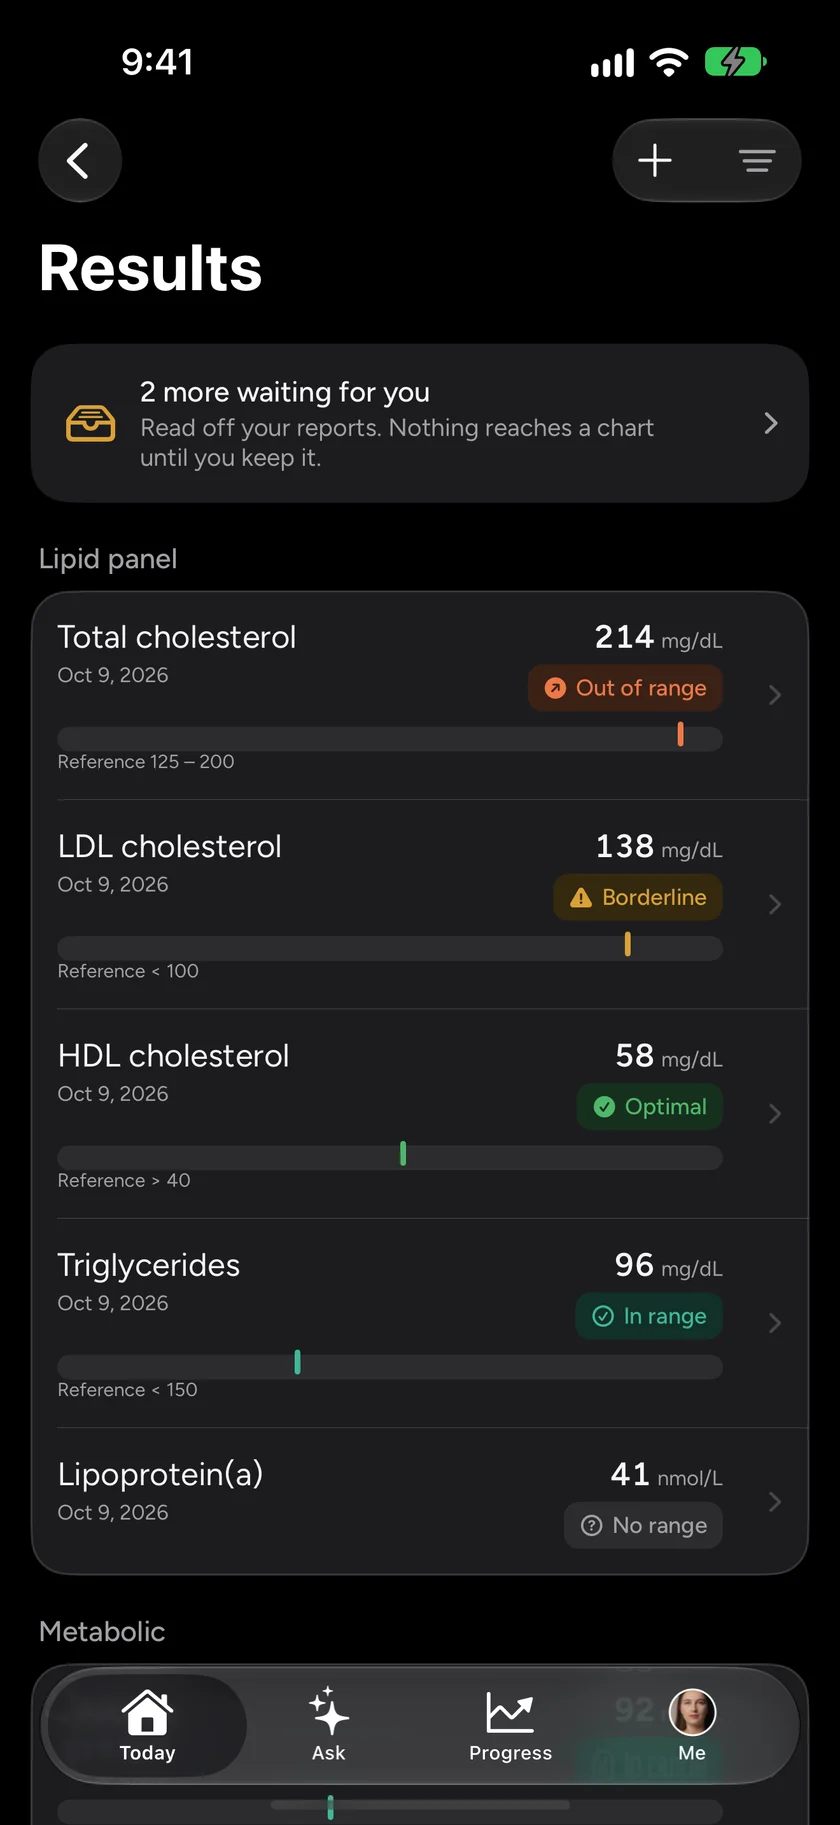
Each kept value gets one of four labels: in range, borderline, optimal, or out of range. That is the gap this piece is about, made visible: a value can be in range without being optimal, and borderline exists precisely for the value that is technically fine and worth watching.
Then Trends puts any marker on a timeline, against both its reference range and an optimal band, and says what happened in plain words: “down 18 over 16 months”, rather than a chart you have to squint at. That sentence is where the story in your numbers usually is.
What it will not do
Wave shows your results as they were reported. It does not diagnose and it does not interpret them for you. The Trends page says so in as many words: a value outside a range is a reason to talk to a doctor, not a finding on its own, and a value inside one does not rule anything out. The labels and bands are there to help you notice and ask better questions. They are not a second opinion.
What Wave adds is memory. Most people’s lab history lives in a drawer, a patient portal or two, and several clinics’ formats. Put it in one place, kept by you, and the question at your next appointment changes from “is this normal?” to “why has this been climbing for two years?” That is a much better question.
Wave Wellness is free on the App Store and Google Play. Download it and see your own Wave Age today.
Wave is for general wellness and is not a medical device. It does not diagnose or treat anything; talk to your doctor about your lab results, every time.