In a classroom experiment published in 1949, the psychologist Bertram Forer gave his students a personality sketch, told each of them it had been written for them alone, and asked how accurate it was. They rated it very highly. Every student had received the same paragraph, put together largely from an astrology book.
The lesson has held up for seventy-odd years: a statement you cannot check feels true as long as it is a little flattering and a little specific. Biological age scores are built to trigger exactly that feeling. You connect a watch or send off a sample, and back comes a number, 41 against a birthday that says 48. It feels like news about you. But if the number cannot tell you what produced it, you cannot tell whether it is right, and you cannot tell what to do about it. That is a horoscope with a decimal point.
What a checkable number needs
Three things, and they are not exotic.
A published model: someone has written down how the inputs combine, tested it against real outcomes, and let other people try to break it. Named inputs: you know what was measured, and just as important, what was missing. And a trail: when the number moves, you can see which input moved it, by how much.
The first is common in research and rare in apps. The third is rarer still, and it is the one that turns a score into something you can use.
The model underneath: PhenoAge
The lab half of Wave Age is PhenoAge (Levine, 2018). Morgan Levine and her colleagues took nine markers from routine blood work, together with chronological age, fitted them against mortality in a large US national health survey, and expressed the result as an age. The nine are thoroughly unglamorous: albumin, creatinine, glucose, hs-CRP, lymphocyte percentage, MCV, RDW, alkaline phosphatase and white cell count. Every one comes off a standard metabolic panel, a complete blood count and an hs-CRP, tests a doctor orders all the time.
That ordinariness is the strength. The paper is public, the weights are public, and anyone with a spreadsheet can run the arithmetic on their own results and get the same answer.
Wave holds one rule hard here: nine markers or no number. If your panel is missing one, say the hs-CRP, the lab half is not computed, and the app names the missing marker rather than filling it in. Filling it in with an average would be easy, and the number would look complete. It would also quietly make your score partly someone else’s.
Turning risk into years
Lifestyle signals arrive in a different currency. Studies report them as hazard ratios: resting heart rate carries about 16 percent more risk for every 10 beats over 60 (Jensen, 2013), and each extra MET of fitness about 13 percent less (Kodama, 2009). To put those on the same scale as the labs, Wave uses one rule taken from a long-observed regularity of human mortality: in adults, the risk of dying roughly doubles with every eight years of age. So a hazard ratio is worth 8 × log2(HR) years.
Work it through and it stops being abstract. A hazard ratio of 2 is eight years, by definition. A resting heart rate 10 beats over 60, a ratio of 1.16, comes to about 1.7 years older. One more MET of fitness, a ratio of 0.87, is about 1.6 years younger. You can check both on a phone calculator.
When labs and lifestyle both exist, the two halves are blended 55 to 45, labs first. Until labs arrive, the estimate runs on lifestyle alone and says so. The whole thing is capped at 10 years younger and 12 older.
Every year has a name
Attribution is what makes the number usable. For each input, Wave re-runs the model with that one input moved to the middle of its healthy range and everything else left exactly as it is. The difference between the two answers is what that input is giving you or costing you, in years.
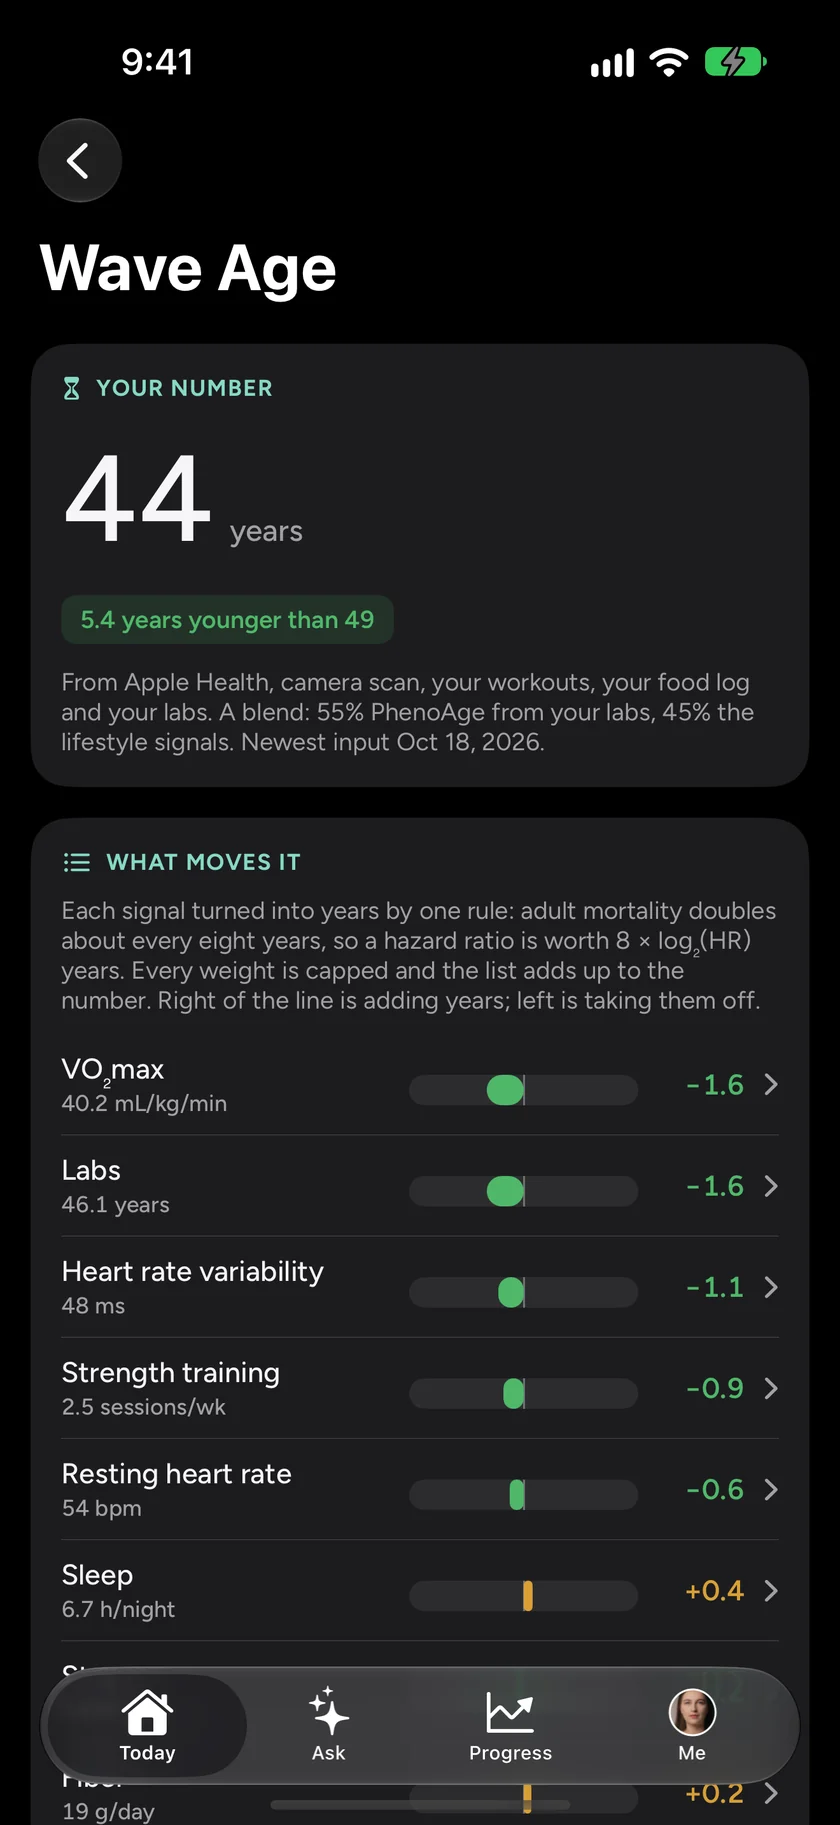
The choice of “the middle of its healthy range” matters. It asks a fair question, what if this were ordinary-good, rather than what if this were perfect, so no input gets credit or blame measured against an ideal almost nobody reaches. The result sits under the number as “What moves it”: fitness taking off a year and a half, sleep adding a few months, each one with its own line.
Why the arithmetic changes what you do
A bare number invites two reactions, pride or worry, and neither tells you what to do on Tuesday. A list of named years does. If sleep is adding 0.4 and fitness is taking off 1.6, you know where the next month of effort pays. You also know which parts are slow and which are fast: the labs move over a year, resting heart rate can move in weeks.
It protects you from the number, too. When Wave Age drops a year, you can see that it dropped because new labs came in, not because something about you changed overnight. When it rises, you can see which line rose. A score you can audit is a score you can disagree with, and only a score you can disagree with deserves your trust.
Showing the arithmetic does not make it exact, though. It makes the inexactness visible. PhenoAge is a population model built from mortality data; it describes risk across many people, not the future of one. The hazard ratios come mostly from observational studies, with their own uncertainty, and the eight-year doubling is an approximation of a pattern, not a law of physics. The number is worth watching over months, by its direction, with its parts in view.
Wave Wellness is free on the App Store and Google Play. Download it and see your own Wave Age today.
Wave is for general wellness and is not a medical device. A Wave Age is an estimate, not a diagnosis or a prognosis; talk to a doctor about what your labs mean for you.